
AI Marketing Tools for Marketing Analytics and Reporting: The 2026 Guide
Marketing teams now pull numbers from a dozen ad platforms, a CRM, and a web analytics suite, and reading that mess by hand takes an analyst most of a week. The best AI marketing tools for analytics and reporting collapse that work into three jobs: pulling every channel’s data into one place, building the dashboard automatically, and answering plain-English questions about what the numbers mean. This guide sorts the category by exactly those three jobs, plus the attribution layer that tells a team which channel actually earned the credit.

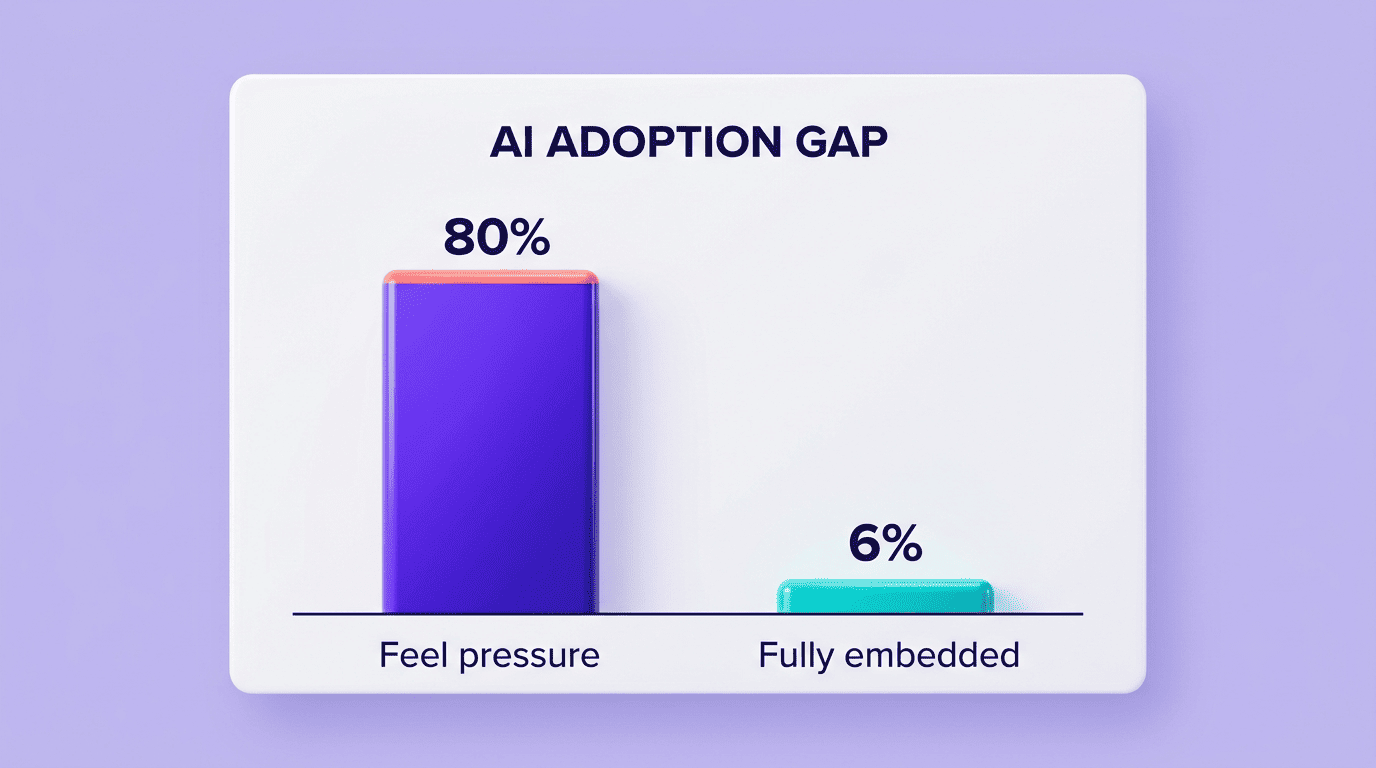
The pressure to adopt this is real but the follow-through lags behind it: 80% of marketers say they feel pressure to bring AI into their analytics workflow, yet only 6% have it embedded in day-to-day reporting, according to Supermetrics’ 2026 Marketing Data Report. That gap is the reason this guide sorts tools by job — data-hub platforms, analytics and attribution engines, and natural-language dashboards — rather than by brand name.
What AI Actually Changes in Marketing Analytics
AI changes three things in a marketing analytics stack: it stitches together data from channels that never talked to each other before, it drafts dashboards and written summaries without a human building each chart, and it answers direct questions about the data in plain sentences instead of requiring a query language. None of that is new capability in isolation — dashboards and connectors existed for years — but combining generative summaries with natural-language querying is what changed between 2023 and 2026.
The clearest way to see the shift is a four-stage framework marketers already use for marketing analytics in general:
- Descriptive — what happened (traffic, spend, conversions)
- Diagnostic — why it happened (channel mix, creative fatigue, seasonality)
- Predictive — what will happen (forecasted revenue, churn risk)
- Prescriptive — what to do about it (budget reallocation, audience changes)
AI tools push teams rightward on that scale, from reading last month’s report to acting on next month’s forecast before it happens.
From dashboards to natural-language answers
A report used to mean exporting CSVs into a BI tool and building charts by hand. Now a marketer can type «which campaigns drove the most revenue last month» into Tableau’s Ask Data, Improvado’s AI Agent, or a similar chat interface and get a written answer with a chart attached. Trust hasn’t caught up with the capability, though — only 13% of marketers say they fully trust AI-generated analytics conclusions, per Ascend2’s 2025 survey, which is why governance and source transparency matter more than raw model quality when picking a tool.
Google Analytics automatically enriches your data by bringing Google machine-learning expertise to bear on your dataset to predict the future behavior of your users.
Google Analytics Help
That predictive layer already ships inside three default GA4 metrics:
- Purchase probability — likelihood a user converts within 7 days
- Churn probability — likelihood a user doesn’t return within 7 days
- Predicted revenue — expected revenue from a user within 28 days
Best AI Tools for Unified Marketing Data and Reporting
Before any AI layer can answer a question, the data has to live in one place. This category — sometimes called a marketing data hub — connects every ad account, CRM, and analytics platform into a single pipeline and then drafts the report on top of it.
Improvado runs the widest connector net. Its AI Agent aggregates data from 500+ marketing sources through 1,000+ connectors and tracks roughly 46,000 predefined metrics, aimed at enterprise teams that need everything from ad platforms to CRM data reconciled in one layer before a human ever opens a dashboard.
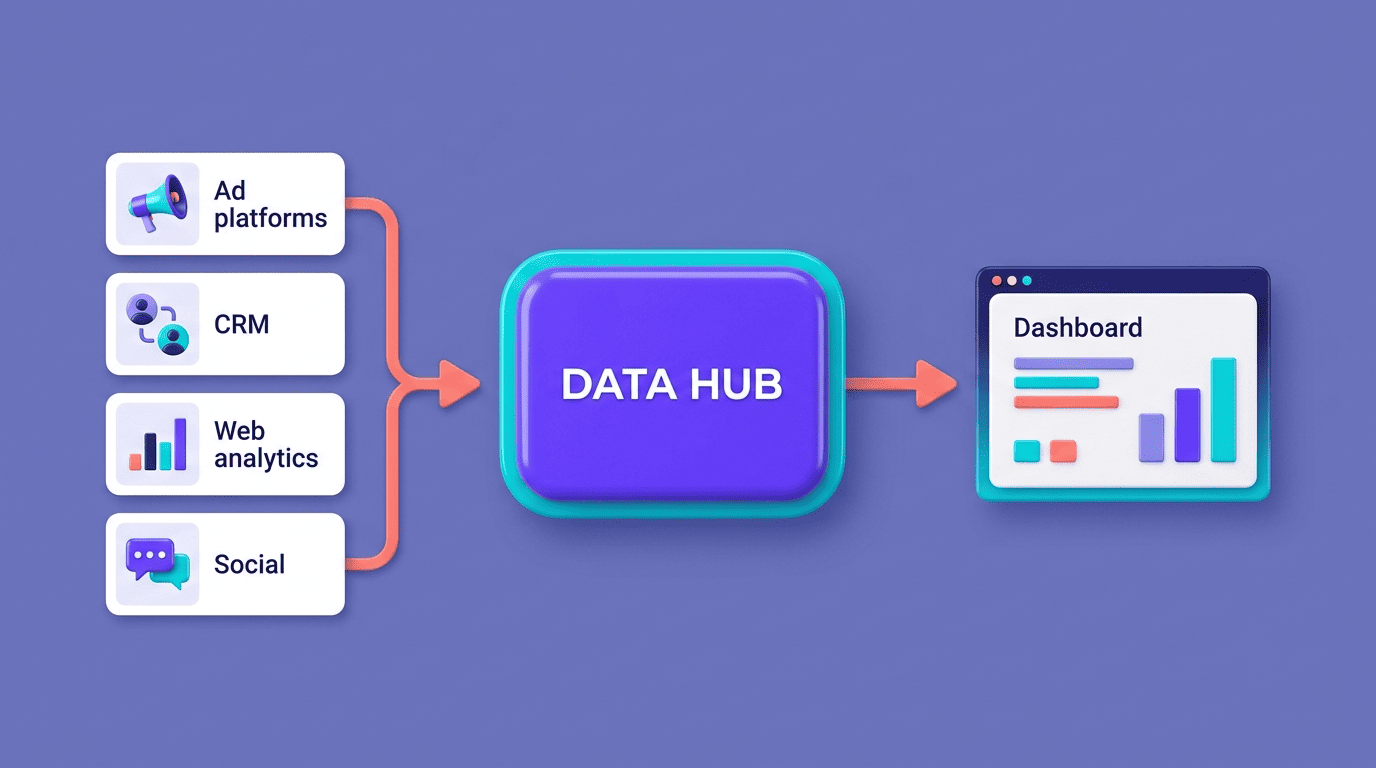
Supermetrics is the cheapest entry point into a connected AI workflow. Plans start around $44/month (billed annually), the platform’s connectors touch over 15% of global ad spend by volume, and it plugs directly into Claude, ChatGPT, and Gemini so a marketer can query pulled data conversationally instead of inside a spreadsheet.
Funnel.io and Whatagraph both target structured agency reporting. Funnel starts near $300/month with 121 connectors, scaling to 500+ connectors on its $600/month Business tier for larger in-house teams, while Whatagraph starts around $229/month with 60+ channel integrations and templated client-facing reports built for agencies managing several accounts at once.
Databox and Domo lean hardest into generative summaries. Databox runs a free tier up to $799/month and ships an AI analyst called Genie that writes plain-language performance summaries; Domo connects 1,000+ sources and layers generative insights on top of its BI dashboards.
Data-hub platforms compared
| Tool | Best for | Integrations | Starting price |
|---|---|---|---|
| Improvado | Enterprise data aggregation | 500+ sources, 1,000+ connectors | Custom (enterprise) |
| Supermetrics | Budget teams, LLM connectivity | 15%+ of global ad spend coverage | From $44/mo |
| Funnel.io | Large in-house marketing teams | 121 connectors (500+ on Business tier) | From $300/mo |
| Whatagraph | Agency client reporting | 60+ channels | From $229/mo |
| Databox | Generative summaries (Genie) | Free tier available | Free–$799/mo |
Best AI Analytics and Attribution Platforms
Once data is unified, a second layer turns it into behavioral and financial answers — what users did on a website or app, and which channel gets credit for a conversion.
Web/product analytics with AI
Google Analytics 4 is free and ships with predictive metrics built directly into the interface, while GA4 360, the enterprise tier, runs roughly $50,000 per year for larger data volumes and support SLAs. Adobe Analytics, powered by its Sensei AI layer, sits at the enterprise end in the $100,000-plus per year range and adds anomaly detection and contribution analysis on top of standard reporting. Mixpanel and Amplitude cover product and behavioral analytics rather than marketing-channel analytics — Mixpanel is free up to 1M monthly events and then bills usage-based (roughly $0.28 per 1,000 events) rather than a flat monthly fee, with both platforms focused on in-app event tracking and AI-assisted funnel analysis.
AI attribution
Cometly reconstructs cross-channel attribution directly from ad spend data and generates budget, audience, and creative recommendations from the result; its Core plan starts around $500/month for up to 40,000 monthly pageviews, with custom Enterprise pricing above that. HubSpot Marketing Analytics, on the Professional tier at roughly $890/month, adds predictive lead scoring and AI-suggested metrics on top of its CRM-native reporting, which matters most for teams that already run HubSpot as their CRM.
| Tool | Category | Key AI feature | Starting price |
|---|---|---|---|
| Google Analytics 4 | Web/product analytics | Predictive metrics (purchase, churn, revenue) | Free (GA4 360 ~$50k/yr) |
| Adobe Analytics | Enterprise web analytics | Sensei anomaly detection | $100k+/yr |
| Mixpanel / Amplitude | Product analytics | AI-assisted funnel analysis | Free–usage-based (~$0.28/1K events) |
| HubSpot Marketing Analytics | CRM-native analytics | Predictive lead scoring | ~$890/mo (Pro) |
| Cometly | Attribution | Cross-channel ad-spend attribution | From $500/mo |
Natural-Language Analytics and AI Dashboards
The third job — asking a question and getting a written, chart-backed answer — is what most people mean when they say «conversational analytics» in 2026.
Ask your data in plain English
Tableau’s Ask Data and Pulse features, available from the Creator tier at $75 per user/month, let a marketer type a question and get an automatic visualization back rather than building one manually. As Tableau’s own documentation puts it, the feature «lets you type a question in common language and instantly get a response right in Tableau.» Salesforce Marketing Cloud Intelligence (formerly Datorama) and Domo both offer comparable natural-language dashboards, with Domo connecting 1,000+ sources and layering generative insight cards on top.

The newer piece of this stack is the Model Context Protocol, an open standard that lets assistants like Claude or ChatGPT query a governed data layer directly instead of requiring an export into spreadsheets first. In practice, that means a marketer can ask a general-purpose AI assistant a question about campaign performance and get an answer sourced from the same underlying data warehouse a BI tool already uses — without copying numbers between systems.
AI for Attribution, ROI and Predictive Forecasting
Unifying data and asking it questions only matters if the answer is trustworthy, and attribution is where marketing analytics gets contested — no two channels agree on who deserves credit for a sale.
Attribution models and metrics that matter
Marketing teams choose between several attribution models, each with a different way of assigning credit across a customer’s path to conversion:
- Last-click — 100% of credit to the final touchpoint before conversion
- First-click — 100% of credit to the first touchpoint
- Linear — credit split evenly across every touchpoint
- U-shaped — heavier weight on the first and last touchpoints
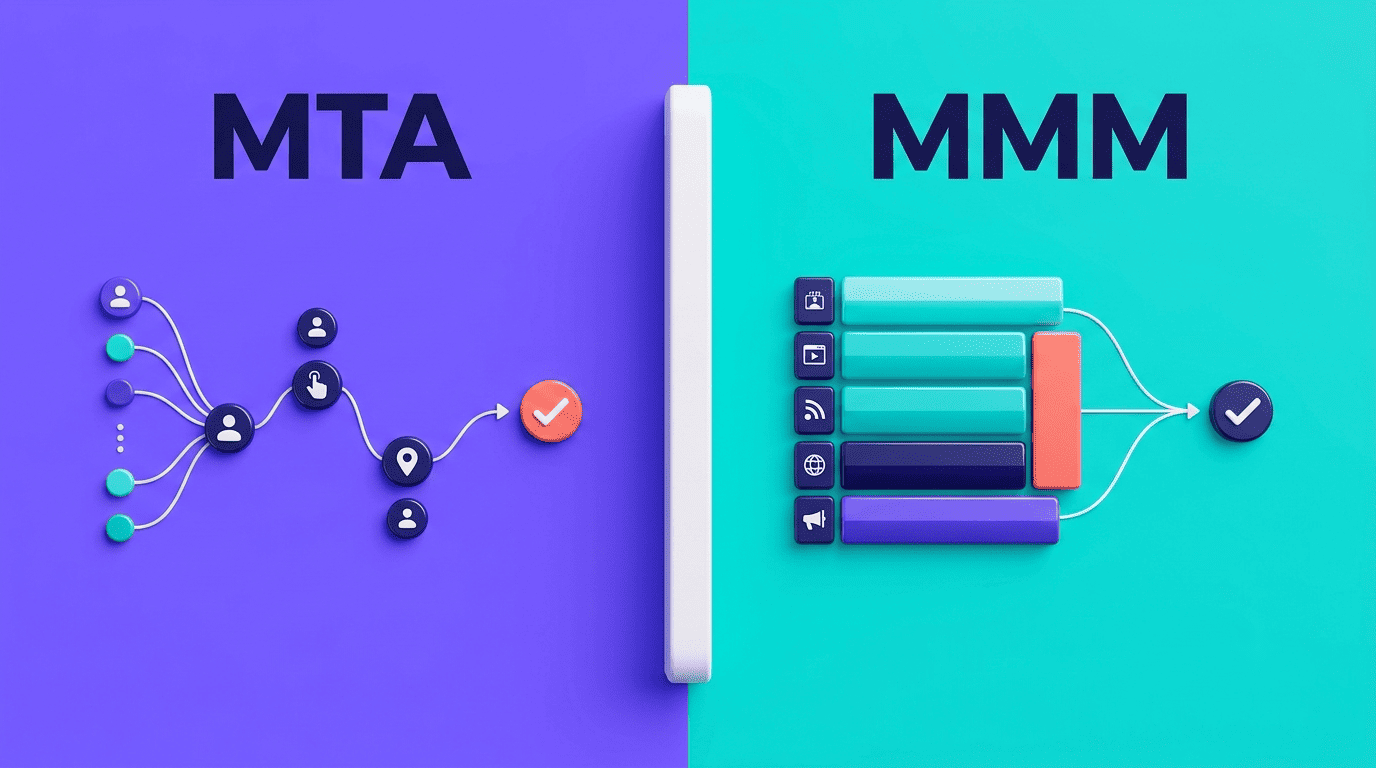
- Multi-touch attribution (MTA) — statistical modeling across all touchpoints
- Marketing-mix modeling (MMM) — aggregate, channel-level modeling that doesn’t rely on user-level tracking
AI-assisted tools increasingly help pick between MTA and MMM automatically based on data volume and privacy constraints, since MTA needs granular user-level data that’s harder to collect post-cookie while MMM works from aggregate spend and outcome data instead. On top of whichever model a team picks, the metrics that actually get reported are ROAS (or blended ROAS/MER when a team wants a single cross-channel number), CAC, CLV/LTV, cost per lead, and churn rate.
How to Choose an AI Marketing Analytics Tool
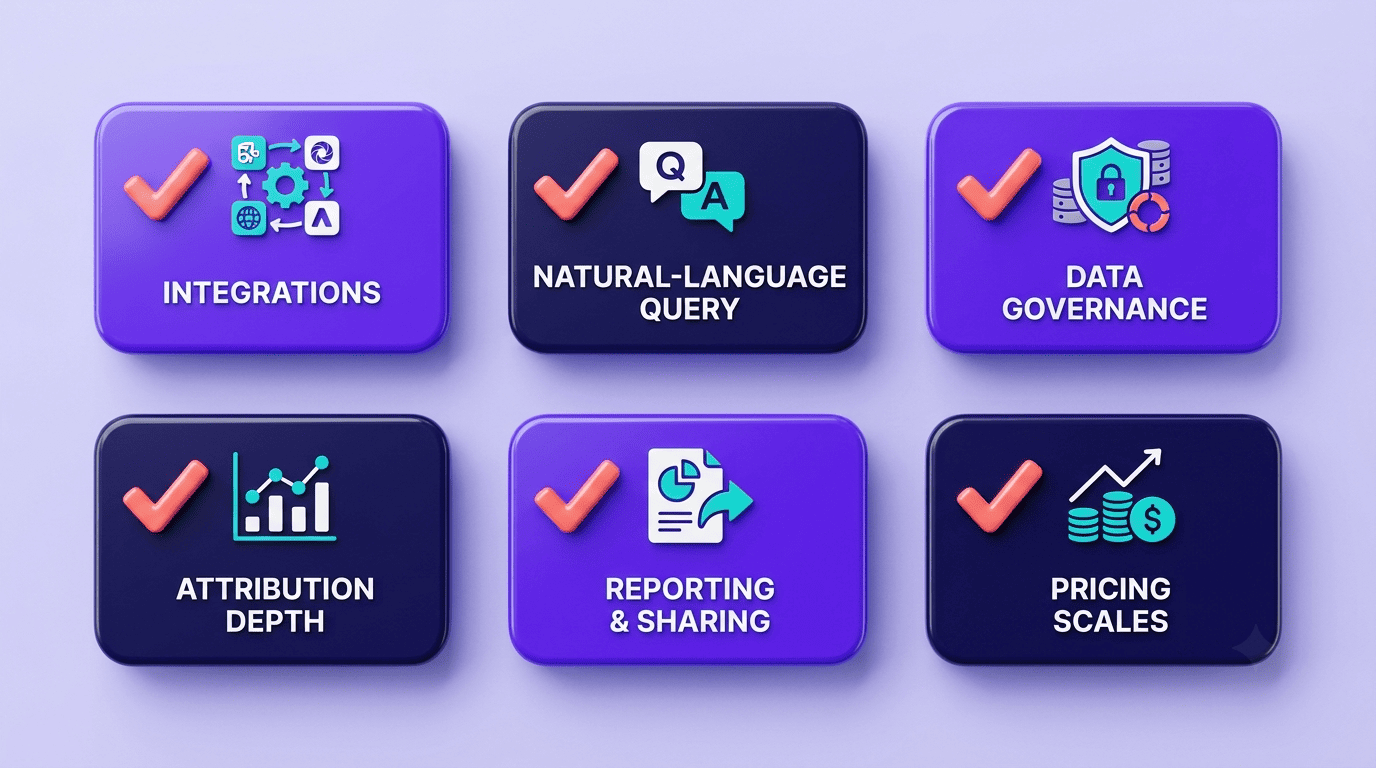
Six criteria separate tools that fit a team’s stack from ones that add another disconnected dashboard.
Six criteria
- Integrations — does it actually cover the ad platforms and CRM already in use, not just the popular ones.
- Natural-language querying — can a non-analyst ask a question in plain English and get a usable answer.
- Data governance and accuracy — is there a governed data layer behind the AI, since reliable AI-generated analytics generally needs a data-cleanliness bar above roughly 70%.
- Attribution depth — does it support MTA or MMM, or only last-click.
- Reporting and sharing — does it generate dashboards and written summaries automatically, and export cleanly to stakeholders.
- Pricing scalability — does cost scale with data volume and seats, rather than jumping to a fixed enterprise wall the moment a team grows.
Practical rollout
- Connect one data hub — Supermetrics or Improvado — to the channels already generating spend.
- Layer in one analytics engine — GA4 plus an attribution tool like Cometly — to measure what’s actually converting.
- Turn on one natural-language dashboard — Tableau or Domo — so the wider team can ask questions without waiting on an analyst.
- Keep a human checking AI-generated conclusions until trust in the outputs is actually earned, not assumed.
Related AI marketing tool guides
Building a full stack? Explore AI advertising and paid ads tools and AI marketing tools for SEO to round out your workflow across the marketing funnel.